
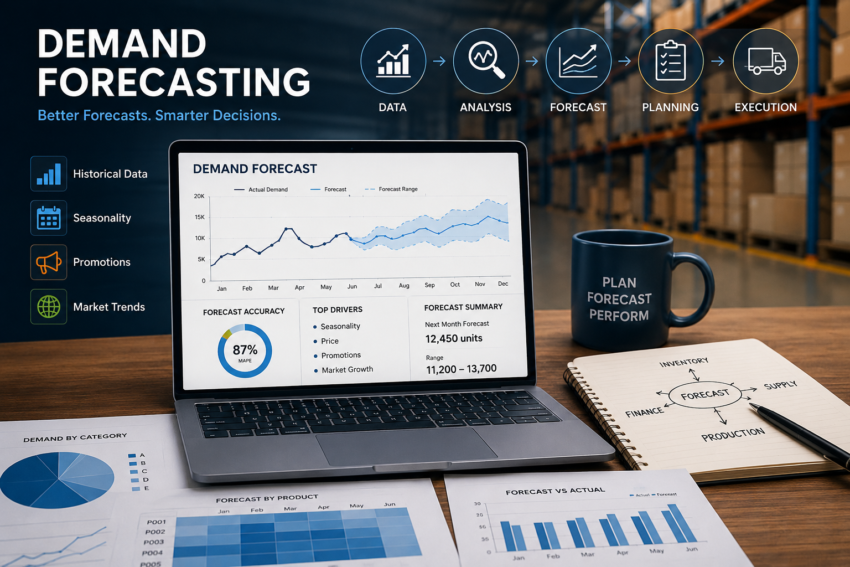
Demand forecasting is the process of estimating future customer demand for a product or service over a defined period. Organizations use forecasts to plan inventory, purchasing, production, staffing, capacity, and logistics. A useful forecast does not attempt to predict the future perfectly; it provides a structured estimate of likely demand and the uncertainty around that estimate.
The distinction is important.
Forecasting is not a promise that exactly 4,275 units will be sold next month. It is a decision input that helps management prepare before actual demand becomes known.
What Is Demand Forecasting?
A practical demand forecasting definition is the systematic estimation of future demand using historical observations, known demand drivers, statistical or machine-learning methods, and relevant business judgment.
The Association for Supply Chain Management describes forecasting as the business function that attempts to predict sales or product usage so appropriate quantities can be purchased or manufactured in advance.
Forecasting therefore supports a wider supply chain management system rather than operating as an isolated analytical exercise.
A demand estimate can influence:
- purchasing quantities;
- production schedules;
- supplier commitments;
- inventory targets;
- warehouse capacity;
- transportation requirements;
- labor planning;
- cash requirements;
- sales and operations planning.
An inaccurate forecast does not automatically mean the forecasting process is poor. Future demand contains uncertainty that no model can completely remove.
The more useful question is whether the forecasting process produces better decisions than the alternatives available to management.
Demand Forecasting vs Demand Planning
Demand forecasting and demand planning are closely related, but they are not exactly the same process.
| Area | Demand Forecasting | Demand Planning |
|---|---|---|
| Main purpose | Estimate future demand | Create an agreed demand view for business planning |
| Typical inputs | Historical demand, seasonality, promotions, price, external variables | Forecast plus commercial knowledge, launches, promotions, customer intelligence and business assumptions |
| Main output | Forecast values and uncertainty | Demand plan used by supply, finance and operations |
| Primary emphasis | Prediction | Cross-functional planning and decision-making |
A statistical forecast might indicate demand of 10,000 units for next month.
The demand planning team may know that a major customer is closing several stores, a marketing campaign has been canceled, or a new contract will begin during the period.
Those facts can justify an adjustment.
The adjustment should still be documented so management can later determine whether the added judgment improved the result.
Why Demand Forecasting Matters in Supply Chain Management
Supply decisions usually have to be made before final customer demand is known.
A supplier may require an eight-week lead time. Production capacity may need to be reserved months ahead. Warehouse labor schedules must be prepared before orders arrive.
Demand forecasting bridges that timing gap.
It helps organizations decide how much capacity and inventory should be available before the actual requirement becomes visible.
ASCM describes demand planning and supply planning as separate but connected processes. The demand side estimates requirements, while supply planning determines how materials, capacity, production, and other resources can satisfy those requirements.
Without that connection, an accurate forecast can still produce little value.
A business gains nothing from predicting high demand correctly if procurement, production, or distribution never receives the information in time to respond.
What Data Is Used for Demand Forecasting?
Historical sales are commonly the starting point, but sales alone do not always represent true demand.
Useful inputs can include:
- historical orders;
- historical shipments;
- point-of-sale data;
- stock availability;
- prices;
- promotions;
- calendar events;
- holidays;
- product launches;
- customer contracts;
- distribution changes;
- market information;
- weather or other external variables when relevant.
Which variables matter depends on the business.
Rainfall may be highly relevant to umbrellas but nearly irrelevant to replacement bearings for industrial machinery.
Observed Sales Are Not Always the Same as Demand
This is one of the most important practical problems in demand forecasting.
Suppose a store sells all 100 units of a product by Friday and remains out of stock for the weekend.
The system records:
Weekly sales = 100 units.
But customers may have wanted 140 units.
The additional 40 units were never sold because no inventory was available.
If a forecasting model learns only from recorded sales, it may conclude that normal demand is approximately 100 units and continue recommending insufficient inventory.
This creates a feedback loop:
Low inventory → lost sales → low recorded demand → low forecast → low inventory.
Forecasting teams should therefore identify periods affected by stockouts, distribution gaps, closures, data failures, or other constraints that prevent recorded sales from representing unconstrained demand.
Demand Forecasting Time Horizons
The appropriate forecast depends partly on how far into the future management needs to make a decision.
| Horizon | Typical Decisions | Example |
|---|---|---|
| Short term | Replenishment, scheduling, warehouse labor, transportation | Daily or weekly orders |
| Medium term | Purchasing, production, inventory targets, capacity allocation | Monthly demand over the next 3–12 months |
| Long term | Facilities, major capacity, supplier strategy, investments | Annual demand several years ahead |
Forecast accuracy generally becomes more difficult as the horizon increases because more future events remain unknown.
The forecast horizon should therefore match the decision lead time.
A company buying a component with a four-month replenishment lead time gains limited value from producing only a one-week forecast.
Main Demand Forecasting Methods
Demand forecasting methods range from very simple rules to complex statistical and machine-learning systems.
A more sophisticated model is not automatically better.
The correct method depends on the data, forecast horizon, demand pattern, business decision, number of items, and cost of errors.
1. Naive Forecasting
A naive forecast assumes the next period will resemble the latest observed period.
For example:
Next month’s forecast = this month’s demand.
This sounds basic, but naive methods are valuable because they create a benchmark.
If an expensive forecasting platform cannot consistently outperform a simple baseline on future data, its additional complexity may not be creating forecasting value.
2. Seasonal Naive Forecasting
A seasonal naive method uses the corresponding observation from the previous seasonal cycle.
For monthly demand:
Forecast for next December = demand from the previous December.
This baseline can be surprisingly competitive when demand has a strong stable seasonal pattern.
3. Moving Average
A moving average forecast uses the average of several recent periods.
For example:
Forecast = average demand during the previous three months.
This smooths short-term noise but can respond slowly when demand changes direction.
A longer averaging window produces greater smoothing. A shorter window reacts faster but also follows random variation more closely.
4. Exponential Smoothing
Exponential smoothing gives greater importance to recent observations while retaining information from earlier periods.
Different versions can represent:
- level;
- trend;
- seasonality;
- combinations of those patterns.
These methods are widely useful because many business series contain recurring level, trend, and seasonal behavior.
5. Regression and Causal Models
Causal models estimate demand using explanatory variables.
Possible predictors include:
- price;
- promotion;
- advertising;
- distribution coverage;
- calendar events;
- economic indicators;
- weather;
- customer activity.
The method can be useful when demand changes systematically with measurable drivers.
A relationship found in historical data should not automatically be assumed to continue forever. Pricing strategy, competitors, customer behavior, and economic conditions can change.
6. Judgmental Forecasting
Judgmental forecasting uses information that may not yet appear in historical data.
Examples include:
- a major customer contract;
- a product launch;
- a planned promotion;
- a store closure;
- a regulatory change;
- a known competitor exit;
- an unusual event.
Judgment is valuable when people possess genuinely new information.
It becomes dangerous when adjustments are driven by optimism, incentives, political pressure, or vague intuition.
7. Machine Learning and AI Demand Forecasting
Machine-learning models can analyze many products, locations, nonlinear relationships, and external variables simultaneously.
Potential inputs include:
- historical demand;
- price;
- promotions;
- product characteristics;
- calendar effects;
- customer behavior;
- location data;
- external signals.
AI demand forecasting can be useful when the organization has sufficient data and a forecasting problem whose complexity justifies the model.
It cannot correct fundamentally unreliable input data.
A sophisticated model trained on incorrect inventory history, missing promotions, or censored stockout periods may simply produce more sophisticated errors.
Qualitative vs Quantitative Demand Forecasting
| Approach | Typical Inputs | Useful When |
|---|---|---|
| Quantitative | Historical observations and measurable predictors | Adequate data exists and relationships have some continuity |
| Qualitative | Expert judgment, customer information, market knowledge | Historical data is limited or major future changes are known |
| Hybrid | Statistical forecast plus structured business judgment | Historical patterns matter but future events also require adjustment |
Many business forecasting systems use a hybrid approach.
The statistical model provides a baseline, while planners apply documented adjustments for information the model does not contain.
How Seasonality Affects Demand Forecasting
Seasonality is a recurring demand pattern associated with a consistent calendar period.
Examples include:
- holiday retail demand;
- summer travel;
- winter heating products;
- weekend restaurant demand;
- back-to-school products.
Seasonality should not be confused with a one-time event.
A large order caused by one unusual customer project may produce a historical spike without creating a recurring seasonal pattern.
Forecast models that cannot distinguish recurring patterns from exceptional events can reproduce demand that will never return.
Trend, Seasonality and Random Variation
A useful way to understand time-series demand is to separate several types of movement.
| Pattern | Meaning | Example |
|---|---|---|
| Level | Typical underlying demand | Approximately 1,000 units per month |
| Trend | Persistent upward or downward movement | Demand increasing by roughly 3% each quarter |
| Seasonality | Recurring calendar pattern | Higher sales each December |
| Random variation | Unpredictable movement | Ordinary month-to-month fluctuations |
| Event effect | Demand influenced by a known event | Temporary promotion |
No forecasting model can eliminate the genuinely unpredictable component.
The purpose is to identify useful repeatable information while quantifying the uncertainty that remains.
Point Forecasts Should Not Hide Uncertainty
A forecast is often presented as one number:
Next month: 12,500 units.
That presentation can create false precision.
A stronger forecast communicates a range of plausible outcomes as well.
For example:
- point forecast: 12,500 units;
- likely operating range: 11,700–13,300 units;
- wider contingency range: 10,900–14,200 units.
Statistical forecasting methods often express this uncertainty using prediction intervals.
Forecasting literature emphasizes that prediction intervals become especially valuable because they show how uncertain a future estimate is instead of presenting one number without context.
Operations can use that uncertainty differently depending on the decision.
A low-cost component with a long replenishment lead time may justify more protection than an expensive item that can be replenished overnight.
How Demand Forecast Accuracy Is Measured
Forecast accuracy should be measured using observations that were not available when the forecast was created.
A basic forecast error can be written as:
Forecast error = Actual demand − Forecast demand
If actual demand is 120 and the forecast was 100:
Error = +20
Under this sign convention, a positive error means the forecast was too low.
Mean Absolute Error — MAE
MAE calculates the average absolute size of forecast errors.
MAE = average of |actual − forecast|
It is easy to interpret because it uses the same unit as demand.
If MAE equals 25 units, the forecast is typically wrong by approximately 25 units in either direction.
Root Mean Squared Error — RMSE
RMSE gives larger errors more influence because errors are squared before averaging.
This can be useful when large misses are particularly undesirable.
It can also make a small number of extreme events dominate the metric.
Mean Absolute Percentage Error — MAPE
MAPE expresses errors as percentages:
MAPE = average of |error ÷ actual demand| × 100
Its percentage format makes it appealing to managers.
However, MAPE creates serious problems when actual demand is zero or close to zero. Forecasting research therefore cautions against treating it as a universal accuracy metric.
Mean Absolute Scaled Error — MASE
MASE compares forecast error with the error of a simple naive benchmark.
This is useful when comparing performance across products that have different sales volumes or measurement scales.
Weighted Absolute Percentage Error — WAPE
Many businesses also use WAPE:
WAPE = total absolute forecast error ÷ total actual demand × 100
The measure avoids calculating a separate percentage for every zero-demand item, but it still needs interpretation.
Large-volume products dominate the result, meaning poor performance on small but critical products can disappear inside an acceptable portfolio-level number.
Forecast Accuracy Should Be Measured at the Decision Level
Suppose total monthly forecast accuracy appears strong.
The result may still hide operationally important errors.
Consider:
| Product | Forecast | Actual | Error |
|---|---|---|---|
| Product A | 1,500 | 2,000 | +500 |
| Product B | 1,500 | 1,000 | -500 |
| Total | 3,000 | 3,000 | 0 |
The aggregate forecast appears perfect.
Operationally, the company may have 500 units of excess Product B and a 500-unit shortage of Product A.
Forecast accuracy should therefore be examined at a level that corresponds to actual inventory, purchasing, capacity, or logistics decisions.
Forecast Bias Is Different From Forecast Accuracy
Accuracy measures the size of forecasting errors.
Bias asks whether errors repeatedly occur in the same direction.
A forecast can have moderate average error while still being systematically too high or too low.
Persistent overforecasting can contribute to:
- excess inventory;
- markdowns;
- obsolete stock;
- unnecessary capacity;
- excess purchasing commitments.
Persistent underforecasting can lead to:
- stockouts;
- lost sales;
- expedited freight;
- overtime;
- production disruption;
- poor customer service.
Management should monitor both error magnitude and error direction.
Use Out-of-Sample Testing Instead of Rewarding Historical Fit
A forecasting model can describe historical data extremely well and still forecast the future poorly.
This happens when a model learns noise or relationships that do not repeat.
Forecasting research therefore distinguishes between fitting historical observations and testing genuine forecasts against data that were not used to build the model.
A practical approach is:
- use earlier observations to build the model;
- forecast a later period;
- compare the forecast with what actually happened;
- repeat the process across multiple historical forecast origins.
This process is known as time-series cross-validation or rolling-origin evaluation.
It provides stronger evidence than simply reporting how closely a model fitted the data used to create it.
Always Compare a Forecast With a Simple Baseline
A complicated forecasting system should earn its complexity.
Before adopting a new model, compare it against simple alternatives such as:
- last period’s demand;
- same period last year;
- recent moving average;
- current production forecast.
If the advanced model does not outperform a reasonable naive benchmark on genuine future observations, there is little evidence that the additional complexity improves forecasting.
This is especially important with AI.
A model can have an impressive technical architecture while adding no practical forecasting value.
How Promotions Distort Demand Forecasting
Promotions can create temporary demand changes that should not automatically become part of the normal baseline.
Suppose weekly sales are usually 1,000 units.
During a 30% discount campaign, sales rise to 1,700 units.
If the forecasting process interprets all 1,700 units as normal demand, later forecasts may be inflated.
Management should ideally distinguish between:
- baseline demand;
- promotional uplift;
- pre-promotion purchasing;
- post-promotion decline;
- competitor effects;
- distribution changes.
An additional complication is demand shifting between periods.
Some customers may buy earlier because of the promotion rather than consume more in total.
The apparent promotional uplift can therefore overstate incremental demand.
New Product Demand Forecasting
New products create a special forecasting challenge because historical demand does not exist.
Possible approaches include:
- using demand from comparable products;
- customer research;
- pre-orders;
- market testing;
- sales estimates;
- product attributes;
- analog launches;
- scenario ranges.
The forecast should usually become more data-driven as actual sales accumulate.
Early forecasts should also contain wider uncertainty ranges because limited evidence supports the estimate.
Intermittent and Lumpy Demand
Some products do not sell every period.
A spare part might show the following monthly demand:
0, 0, 4, 0, 0, 0, 7, 0, 2, 0, 0, 0
Traditional percentage metrics become difficult when many observations are zero.
A simple average can also misrepresent the pattern because demand occurs in irregular batches.
Organizations should treat intermittent-demand items differently from stable high-volume products, especially when the item is critical and replenishment lead time is long.
Forecast Hierarchies: Product, Location and Time
Demand can be forecast at several levels:
- total company;
- region;
- country;
- warehouse;
- customer;
- product family;
- SKU;
- day;
- week;
- month.
Higher-level forecasts often appear more stable because individual errors can cancel one another out.
Operations may still require lower-level detail.
A national demand forecast cannot tell a distribution team how many units should be positioned in each warehouse.
This creates a practical principle:
Forecast at the level required for the decision, while using aggregation where it genuinely improves signal and coordination.
Demand Forecasting and Logistics Planning
Forecasts influence more than inventory and production.
They also affect logistics management.
Expected demand can determine:
- warehouse labor requirements;
- storage capacity;
- transport reservations;
- delivery routes;
- container requirements;
- distribution-center replenishment;
- peak-season carrier contracts.
A logistics team that first learns about a major demand increase after customer orders arrive has fewer and usually more expensive response options.
Forecast information creates time for preparation.
A Practical Demand Forecasting Process
Step 1: Define the Decision
Start by identifying what management needs the forecast to support.
Examples:
- weekly replenishment;
- monthly production;
- annual capacity planning;
- promotion inventory;
- supplier commitments.
This determines the appropriate horizon and level of detail.
Step 2: Define the Demand Measure
Clarify what is being forecast.
Possible measures include:
- customer orders;
- shipments;
- point-of-sale demand;
- consumption;
- service requests.
Different definitions can produce different answers.
Step 3: Audit Historical Data
Identify:
- missing periods;
- duplicate transactions;
- stockouts;
- one-time orders;
- returns;
- product substitutions;
- promotions;
- changes in product codes.
Step 4: Create a Baseline
Generate at least one simple benchmark forecast.
This creates a minimum standard that more advanced methods should beat.
Step 5: Test Alternative Methods
Compare methods according to performance on historical periods that were not available when each simulated forecast was made.
Do not select a model simply because it fits the full historical series most closely.
Step 6: Add Known Business Information
Include relevant events that historical patterns cannot represent.
Examples include:
- confirmed promotions;
- new customers;
- lost contracts;
- launches;
- planned closures;
- distribution expansion.
Step 7: Produce Forecast and Uncertainty
Communicate both the expected value and a reasonable range when the decision requires it.
Step 8: Convert the Forecast Into a Plan
A forecast by itself does not purchase materials or schedule production.
Supply planning must translate expected demand into actions involving:
- inventory;
- capacity;
- procurement;
- production;
- warehousing;
- transport.
Step 9: Measure Results
Once actual demand becomes available, compare forecast and actual performance.
Step 10: Learn From Error
Separate ordinary uncertainty from correctable process problems.
This continuous cycle supports operational efficiency because management improves the quality of planning decisions instead of repeatedly compensating for avoidable forecast failures through excess inventory or emergency action.
A Practical Demand Forecasting Example
Consider a fictional company selling portable cooling products through several retailers.
The Historical Pattern
Monthly demand averages approximately 8,000 units but increases during warmer months.
Last year’s July demand reached 14,000 units.
The Initial Forecast
A seasonal model estimates 14,600 units for the coming July based on historical seasonality and recent growth.
New Information
The commercial team knows two additional facts:
- a retailer adding 50 stores is expected to increase distribution;
- a planned promotion has been reduced from four weeks to two.
The team quantifies both effects rather than simply increasing the forecast because sales managers feel optimistic.
The Final Demand Plan
The statistical baseline is adjusted to 15,200 units.
The company also estimates a wider range of approximately 13,500–17,000 units because weather and promotion response remain uncertain.
The Supply Decision
Management does not automatically purchase enough material for the top of the range.
Instead, it:
- commits enough capacity for the base plan;
- reserves additional supplier flexibility;
- positions selected safety stock;
- reviews actual demand weekly;
- defines when additional production should be released.
The forecast therefore supports a flexible decision rather than pretending uncertainty does not exist.
Common Demand Forecasting Failures
Forecasting Sales During Stockouts as Normal Demand
Warning sign: A product repeatedly sells out while the forecast remains low.
Why it fails: Recorded sales are constrained by product availability.
Better approach: Flag stockout periods and estimate whether unmet demand should be restored or otherwise accounted for.
Choosing the Most Complicated Model
Warning sign: The forecasting project emphasizes model sophistication but cannot demonstrate improvement over a naive baseline.
Why it fails: Complexity does not guarantee better out-of-sample prediction.
Better approach: Benchmark advanced methods against simple forecasts using genuine holdout periods or rolling-origin tests.
Using Only MAPE
Warning sign: Forecast accuracy behaves erratically for slow-moving products.
Why it fails: Percentage errors become undefined or unstable when actual demand is zero or close to zero.
Better approach: Use metrics suited to the demand pattern and review several measures rather than relying on one percentage.
Changing Forecasts Without Recording the Reason
Warning sign: Planners manually override statistical forecasts but nobody can later explain why.
Why it fails: The organization cannot determine whether human judgment adds forecasting value.
Better approach: Record the adjustment, reason, source of information, and final outcome.
Forecasting at the Wrong Level
Warning sign: Total demand is accurate but individual warehouses or products experience serious shortages.
Why it fails: Aggregate errors cancel while operational decisions require lower-level information.
Better approach: Match forecast granularity to the decisions being made.
Ignoring Forecast Bias
Warning sign: Forecasts consistently exceed actual demand even though the average error metric appears acceptable.
Why it fails: Directional error creates systematic inventory or service consequences.
Better approach: Track bias separately from absolute accuracy.
Using Data That Would Not Have Been Known at Forecast Time
Warning sign: A model performs extremely well in historical testing but poorly after deployment.
Why it fails: Historical model evaluation may accidentally include future information.
Better approach: Reproduce what data would genuinely have been available at each forecast origin.
Treating Every Demand Spike as a Trend
Warning sign: One exceptional order causes forecasts to remain elevated for months.
Why it fails: A one-time event is interpreted as repeatable underlying demand.
Better approach: Classify major events and determine whether they should influence the future baseline.
Forcing Forecast Accuracy to 100%
Warning sign: Management regards any forecast error as a planning failure.
Why it fails: Real customer demand contains uncertainty.
Better approach: Improve forecast quality while designing supply decisions that can tolerate reasonable forecast error.
How AI Can Improve Demand Forecasting
AI and machine-learning methods can create value when forecasting involves large volumes of data, complex demand drivers, or many product-location combinations.
Potential advantages include:
- automated model selection;
- nonlinear relationships;
- large numbers of predictors;
- rapid forecasting across many SKUs;
- detection of changing patterns;
- automated exception identification.
The technology also introduces new requirements.
Management needs:
- reliable input data;
- clear forecasting definitions;
- out-of-sample evaluation;
- model monitoring;
- override controls;
- ownership of exceptions;
- a method for detecting deterioration after deployment.
AI should improve the forecasting process rather than becoming the objective of the project.
When a Simple Forecast Is Better
A simple forecasting method may be the better choice when:
- the series has a stable pattern;
- little historical data exists;
- the forecast has low economic importance;
- users need a highly transparent method;
- complex models do not improve validation accuracy;
- data quality cannot support additional complexity.
A model should be judged by the decision value it creates, not by how advanced its name sounds.
Demand Forecasting Decision Checklist
| Question | What Management Should Know |
|---|---|
| What exactly are we forecasting? | Orders, sales, shipments, consumption, or unconstrained demand |
| What decision will use the forecast? | Inventory, production, procurement, capacity, logistics, or finance |
| What forecast horizon is required? | Period needed to act before demand occurs |
| Is historical data trustworthy? | Stockouts, promotions, returns, missing data and coding changes |
| What pattern exists? | Level, trend, seasonality, intermittency, events |
| What baseline are we beating? | Naive, seasonal naive or another simple benchmark |
| How was the model validated? | Performance on data unavailable at forecast creation |
| Which metric fits the problem? | MAE, RMSE, MASE, WAPE, bias, or a combination |
| What business adjustments were made? | Reason, amount, owner, and source of new information |
| How uncertain is the forecast? | Prediction interval or scenario range |
| How does supply respond? | Inventory, capacity, purchasing, production and logistics actions |
| How will the process learn? | Error analysis, bias review and model updates |
Frequently Asked Questions
What is demand forecasting?
Demand forecasting is the process of estimating future customer demand for a product or service. Forecasts use historical observations, statistical or machine-learning methods, known demand drivers, and relevant business judgment to support decisions involving inventory, purchasing, production, capacity, staffing, and logistics.
Why is demand forecasting important?
Demand forecasting is important because many supply decisions must be made before customer demand is known. A useful forecast gives management time to arrange materials, inventory, production capacity, warehouse resources, transportation, and labor while balancing the cost of excess supply against the risk of shortages.
What are the main demand forecasting methods?
Common demand forecasting methods include naive forecasting, moving averages, exponential smoothing, seasonal models, regression, causal models, judgmental forecasting, and machine-learning techniques. No single method is best for every product or organization, so models should be tested against future observations and simple benchmarks.
What is demand forecasting in supply chain management?
Demand forecasting in supply chain management estimates future customer requirements so the supply chain can prepare materials, production, inventory, warehouses, transportation, and other resources. The forecast becomes useful when it is connected to demand planning and supply planning rather than remaining only an analytical report.
What is the difference between demand forecasting and demand planning?
Demand forecasting primarily estimates future demand, while demand planning combines forecasts with business information and cross-functional judgment to create an agreed demand view for planning. A statistical forecast is therefore often an input into the wider demand planning process.
How is demand forecast accuracy measured?
Forecast accuracy can be measured with MAE, RMSE, MAPE, MASE, WAPE, and related measures. The appropriate metric depends on the demand pattern and business decision. Accuracy should be evaluated on observations that were not used to fit the forecasting model.
What is forecast bias?
Forecast bias is a persistent tendency for forecasts to be systematically above or below actual demand. Bias matters because repeated overforecasting can create excess inventory, while repeated underforecasting can contribute to shortages, expediting, and lost sales.
Can AI improve demand forecasting?
AI can improve demand forecasting when large datasets, multiple demand drivers, nonlinear patterns, or thousands of product-location combinations make simpler methods inadequate. AI models still require reliable data, appropriate validation, monitoring, and comparison with simpler baselines to demonstrate that they improve real forecasting performance.
What data is required for demand forecasting?
Common data includes historical orders or sales, availability, prices, promotions, seasonality, calendar information, customer activity, distribution changes, product launches, and relevant external variables. The required inputs depend on what actually influences demand in the specific business.
How often should demand forecasts be updated?
Forecast frequency should reflect how quickly demand changes and how frequently the organization can act on new information. Fast-moving operations may update forecasts daily or weekly, while longer-term capacity decisions may use monthly or quarterly forecasts. Updating more frequently creates little value when the underlying decision cannot change.
Can demand forecasting ever be completely accurate?
No forecasting method can eliminate genuine future uncertainty. The goal is not perfect prediction but a forecast that is accurate enough to improve decisions, communicates uncertainty, performs better than reasonable alternatives, and allows the organization to respond when actual demand differs from expectations.
Final Takeaway
Demand forecasting helps organizations make decisions before actual customer demand becomes known.
The strongest forecasting processes combine useful historical patterns, appropriate analytical methods, relevant business knowledge, and disciplined measurement.
More complexity does not automatically create a better forecast.
A forecasting method should demonstrate its value against simple baselines using information that genuinely would have been available at the time of prediction.
Management should also remember that sales are not always true demand, forecast accuracy can disappear when data is aggregated too broadly, MAPE is unsuitable for some demand patterns, and one point estimate can hide substantial uncertainty.
The final objective is not the forecast itself.
It is the decision the forecast enables.
A useful forecasting process therefore asks:
“Given what we know today, what demand is reasonably likely, how uncertain is that estimate, and what supply decision gives us the best result if reality differs from the forecast?”
When organizations can answer all three parts, forecasting becomes a practical management capability rather than an exercise in predicting one exact number.